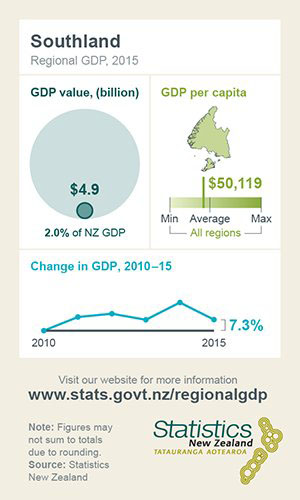
Southland’s gross domestic product (GDP) fell by 9.9 per cent for the year ended March 2015, due to a decrease in the agriculture industry – mainly dairy cattle farming. That followed a GDP increase of 11 per cent in 2014, led by agriculture.
The economies of 11 of New Zealand’s 15 regions increased in the latest regional GDP figures from Statistics New Zealand.
 From 2010–15, Southland’s economy increased 7.3 per cent, led by the transport, postal, and warehousing industries. In 2015, Southland accounted for 2 per cent of New Zealand’s GDP.
Auckland and Canterbury had the largest increases in nominal value (today’s dollars and unadjusted for inflation) in gross domestic product by region.
Auckland’s GDP increased $5.7 billion (6.9 per cent), Canterbury’s $2.3 billion (7.3 per cent), and Wellington’s $1.2 billion (3.7 per cent). The national increase was $8.7 billion (3.7 per cent).
“The large increase in Auckland reflects strong performances in construction, transport, and finance,” senior national accounts manager Susan Hollows said. “Canterbury’s increase is associated with the Christchurch rebuild, which offset a decline in agricultural activity.”
Decreases were recorded in Southland at $0.5 billion (9.9 per cent), Waikato at $0.4 billion (2.2 per cent), Taranaki at $0.3 billion (3.3 per cent) and the West Coast at $0.1 billion (5 per cent). These decreases reflected a fall in agricultural activity.
Taranaki had the highest GDP per capita ($75,941), followed by Wellington ($65,974) and Auckland ($56,997). The Northland region had the lowest GDP per capita ($35,103). The national average was $52,953.
New Zealand’s total GDP was $241.2 billion for the year ended March 2015. The North Island contributed 76.7 per cent to total GDP, and the South Island 23.3 per cent.
Auckland’s contribution to total GDP for the year ended March 2015 was 36.6 per cent. Canterbury contributed 13.6 per cent, with Wellington narrowly behind at 13.5 per cent. The smallest contribution was from the West Coast region (0.7 per cent).

